
Content Warning: This post contains language regarding option trading. Readers looking for the usual crap should peruse old posts or copies of Mad Magazine. Any discussion of investments herein is for entertainment purposes only. Dirt Lease does not give investment advice. Readers should consult their own advisers before making an investment decision. Writers should avoid the repetition of words in close proximity. This applies in particular to the noun ‘investment’ and morphological permutations thereof. Trading options involve risk. An option position can result in the loss of more than the amount of money initially invested. Past performance does not guarantee future results – except when it does.
The equity options market has been behaving strangely lately. This has manifested itself in two ways, i.e. time skew in VIX puts and low implied volatility in out of the money SLV options. Either or both might present trading opportunities.
An option is a contract that grants the holder the right, but not the obligation, to buy or sell an asset (the ‘underlying’) at a specified price (the ‘strike price’) on or before a specified date (the ‘expiry date’).[1] A ‘call option’ grants the holder the right to buy the underlying; a ‘put option’ grants the holder the right to sell the underlying. To the extent that the price of the underlying is greater than a call option’s strike price, the call is ‘in-the-money’, or ‘ITM’. To the extent that the price of the underlying is less than a put option’s strike price, the put ITM. If the price of the underlying is the same as an option’s strike price, the option is ‘at-the-money’, or ‘ATM’. If an option is neither ITM nor ATM, it is ‘out-of-the-money’, or ‘OTM.
The extent to which an option is ITM, ATM or OTM is called the option’s ‘moneyness’.
The party who holds the rights granted by an option is called the ‘holder’ of the option, or the ‘long party’. The party who grants those rights is called the ‘writer’ of the option, or the ‘short party’. To compensate the writer of the option for the rights that she gives up when she enters into the option, the holder pays the writer a price (the ‘premium’).
ITM premium is composed of two components, i.e. ‘inherent value’ and ‘option value’. Inherent value is the difference between the strike price of an ITM option and the price of the underlier. For example, if MSFT is trading at 105, an MSFT call with a strike price of 100 has inherent value of $5. Option value is everything other than inherent value. For example, if MSFT is trading at 105 and an MSFT call with a strike price of 100 is trading for $7.50, the option has intrinsic value of $5 and option value of $2.5. Since ATM and OTM options do not have inherent value, all of their premium consists of option value.
Option pricing formulae take in a bunch of inputs and spit out a bunch of outputs. Inputs include moneyness, time to maturity, dividends on the underlying, interest rates, and volatility. Volatility is where the rubber meets the road.
In statistics, volatility is the extent to which instances of an event diverge from the mean.[2] This can be expressed as the ‘variance’ from the mean or, after some arithmetical massaging, standard deviation from the mean. In option pricing, ‘historical volatility’ means statistical volatility. Historical volatility is not the input that is plugged into an option pricing formula. Instead, option pricing formulae require expected volatility as an input. Expected volatility is the extent to which prices are expected to deviate from the mean before option expiration. This can differ significantly from historical volatility when an event that could likely affect prices, such as an earnings release or an election, will occur prior to option expiration.
But that’s not all.
The equity option market is subject to ‘long bias’. That means more people own equity shares than hold short positions in equity shares. [3] Options can be used for two purposes, i.e. speculation or hedging. Since most people who are in the equity markets own shares, the most common option hedging technique is the purchase of puts. That means that, when market participants fear a market downturn, they buy more puts. That drives the price of puts up. Because of a phenomenon called put-call parity, when the price of ATM puts goes up, the price of ATM calls goes up.[4]
Like every formula, option pricing formulae can be used to reverse-engineer their inputs, if their output is known. Of the five inputs that option pricing formulae require, only one, i.e., expected volatility, is unknown at the time of pricing. The other four can be looked up on a Bloomberg terminal. Predicting future volatility, by contrast, is an art as well as a science. What this means is that, when the actual price of an option fluctuates with the ebb and flow of the market, it is possible to reverse engineer the volatility value that should have been input in order to produce the actual price of the option. This value is called implied volatility. Implied volatility is the expected volatility that actual prices imply.
The CBOE VIX index is an index of implied volatility. It tracks the implied volatility in near-term options on the S&P index. Effectively, when the price of S&P indexes increases, the VIX goes up. When they decrease, it goes down.
Two things, which are not entirely consistent with each other, are true of the VIX. The first is that it correlates negatively with the S&P. As discussed above, equity markets have a long bias. This means that, when market participants think stock prices will go down, option prices are bid up. When option prices go up, that reflects an increase in implied volatility. Stock prices down, implied volatility up. Implied volatility up, VIX up.
The second thing about the VIX is that it tends to spike, rather than to trend. I believe that this is because the VIX is motivated by psychology. Implied volatility goes up when people are scared of a bear market. That said, people have short memories. They panic when a plane flies into a building or when a pandemic disrupts supply chains, but they forget about it quickly. When they get scared, the VIX goes up. When they forget, the VIX reverts to the mean.
These two things are not entirely consistent with each other because the S&P tends to form trends. Because of that, it is impossible for the VIX to both spike and correlate with the S&P. Nevertheless, when there is a big fall in the S&P, the VIX tend to spike, and when the S&P is on an up-trend, the VIX moves sideways at the bottom of its range, or trends shallowly downward.
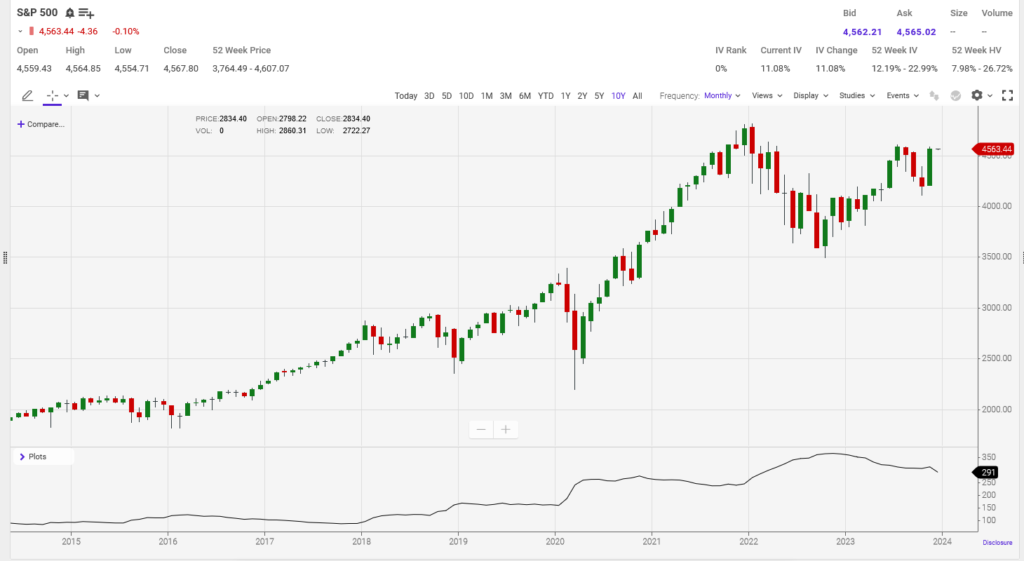
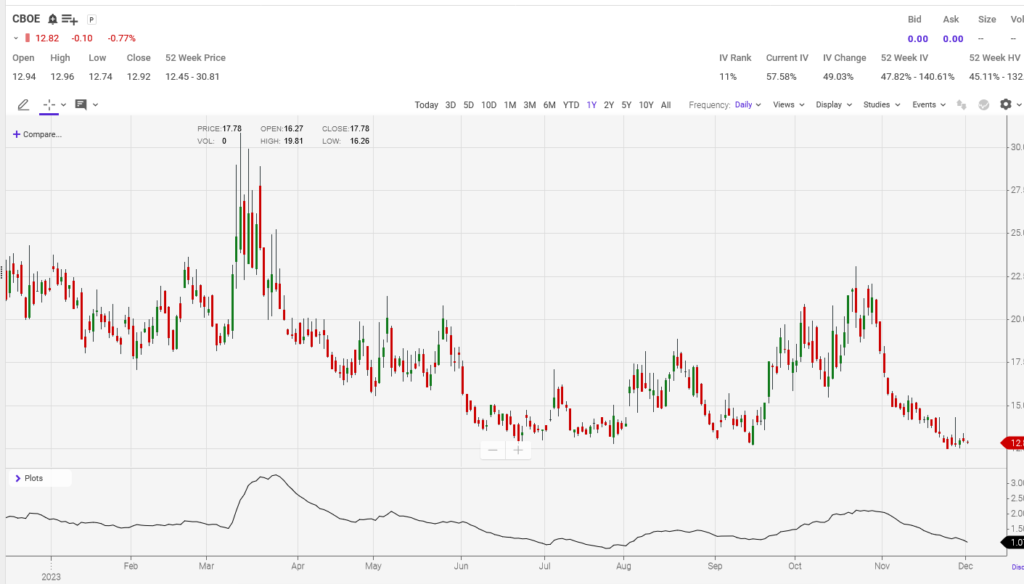
The foregoing is illustrated in Charts 1 and 2, below. Chart 1 is a chart of the VIX over the past ten years. Chart 2 depicts the S&P index over the same time-frame. As you can see, big, sudden moves tend to happen in opposite directions at the same time in both indices, but the S&P trends, while the VX reverts to the mean:
Chart 1: CBOE VIX Index, 2013-2023

Chart 2: S&P Index, 20213-2023
You can trade cash-settled options on the VIX. That is one of the instruments that we are gathered to discuss. Time skew in the VIX has been acting strangely lately.
By ‘time skew’, I mean the difference in value between options with different maturities. Holding other factors equal, the closer to maturity an option is, the less valuable it will be. That is why time to maturity is one of the inputs to any option pricing formula.
An option is a wasting asset. The value of an option decays over time. Option time-decay is not linear. It speeds up as the option nears maturity.
A trading strategy designed to take advantage of non-linear time-decay is the calendar spread. In a classic calendar spread, a trader shorts a near-term option and buys a longer-term option with the same underlying and strike price. Because long-term options are more expensive than short-term options, these trades have to be entered into at a net debit. The play behind a calendar spread is that, so long as the price of the underlying does not move too much, the value gained on the short option position as the value of the option diminishes to zero will more than offset time-decay on the long position. In the case of a big move in the underlying, calendar spreads lose money. This is because near-term ITM options are more sensitive to changes in the underlying than farther-term ITM options. However, the total amount at risk in a calendar spread tends to be the debit paid to enter the position.
Table 1 shows an option ladder for VIX calls and puts with maturities of nineteen days out and forty-seven days out. Calls are on the left, puts are on the right. The underlying is at 12.88. For context, I have also included a chart of the underlying over the past year. The general trend in the underlying is down, but as discussed above, the VIX tends to revert to the mean, and it looks ripe for a reversion:
Table 1: VIX Options

Chart 3: VIX, 12 Months To Date:
The strange thing about the put prices is – they are inverted. In the normal order of things, longer-dated options are more valuable than short-dated options, but in this case, near-term options are more expensive. A January 13 put is offered at .34, while a December 13 put is bid at .49. There are some instruments in which this phenomenon makes sense. For example, options on futures in which the futures contract suffers from contango, i.e., instruments in which near-term futures prices tend to be less than longer-term futures prices show this feature. However, that is not the case here, because VIX options reference an index, rather than futures contracts. Something that should be cheaper is going for more than something that should be more expensive. This is fucked.
It gets curiouser. When I noticed this two weeks ago, I put on a trade. I shorted a few December contracts and longed a few January contracts, for a small credit. Since then, the skew has gotten wider, and I have an unrealized loss on my books. I am not sure whether to double down, close the trade when the December contracts mature, or roll it out when that happens. It seems to me that the trade has to win. The longer-term contract has some option value, and the short-term contract can only settle for its intrinsic value on maturity. It is the same underlying for both options, for feck’s sake. That said, I could be missing something. If so, it would not be the first time. This might be an opportunity to profit from arbitrage or, at least, a probable reversion to the mean, or it might be me trading while ignorant. Readers who know the answer are encouraged to write in and enlighten us.
The next instrument we are gathered to discuss is the silver ETF, SLV. OTM options on SLV are exhibiting behavior that might create an opportunity to go long volatility.
Here is a chart of SLV over the past year:
Chart 4: SLV, 12 Months To Date:

The thing to note about the SLV chart is that SLV is at the top of a range. When assets reach the edge of a range, they tend to do one of two things. They either retreat and continue trading inside the range, or they break out. When an asset breaks out of a range, the break-out tends to be the product of significant factors. Because of that, it is not uncommon for breakouts to signal the beginning of a strong move.
Now, here is an option ladder for near-the-money calls and puts on SLV with a maturity date of January 5, 2024:
Table 2: SLV Options
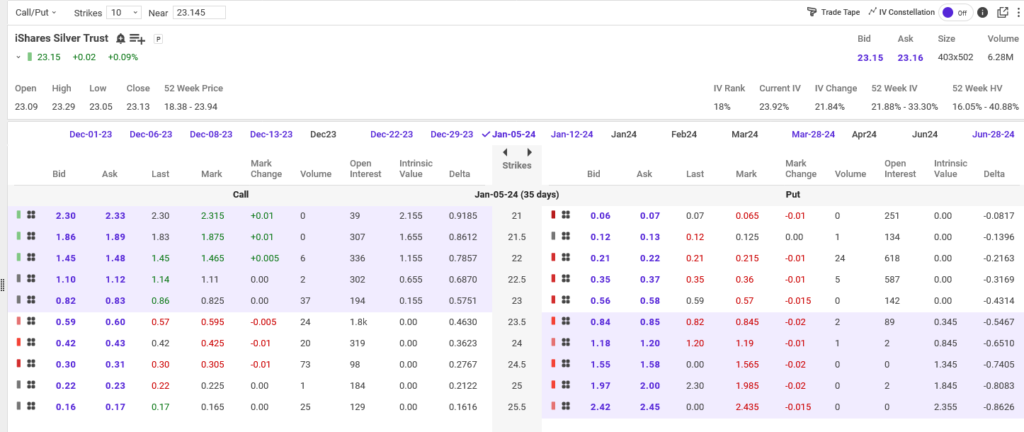
As you can see, OTM options are cheap relative to near-the-money options (stated otherwise, the implied volatility of OTM options is less than that of near-the-money options). This presents the opportunity for a ratio spread. For example, if a trader were to short one 23 put and buy two 22 puts, she would collect a net credit of .13 ($13, with the applicable multiplier). That would mean that, if SLV were to trade at or above 23 on expiry, she would collect $13 per contract. She would lose up to a maximum of $77 if SLV were to trade between 23 and 21.62 on expiry. If SLV were to fall below 21.62, she would win up to $43.23. Effectively, she would make money if SLV were to stay where it is, break out of its range to the up-side, or end up in the bottom half of its current range.
A similar trade could also be done with calls. If a trader shorted a 23.5 call and bought two 25.5 calls, he would collect a net credit of .25 ($25). If SLV traded below 23.5 on expiry, he would pocket the $25. If SLV traded between 23.5 and 26.38 at expiry, he would lose up to a maximum of $175 per contract. If SLV traded above 26.38 at expiry, his gain could be limitless. This is a trade that could profit from a reversion to the mean or a strong breakout. It would lose in the case of a weak breakout.
I understand that this is the type of trade that made Nassim Taleb rich. When the markets made big moves – 1987, 9-11 2008, 2020 – he cleaned up. The small premium that he collected when the market did nothing kept him in beer in olive oil between the windfalls. What he won in those two scenarios more than offset what he lost when the market made half-assed moves. Pay your money, place your bets – and try not to bloviate too much.
While I have been firing off trades, the usual crap has also been happening in the parks. Here’s another chart, that illustrates a repair that Mike, the manager at my park in northern New York, recently did to fix the mother of all water leaks:
Chart 5: Water Used and Water Consumed, 11/23-11/30:
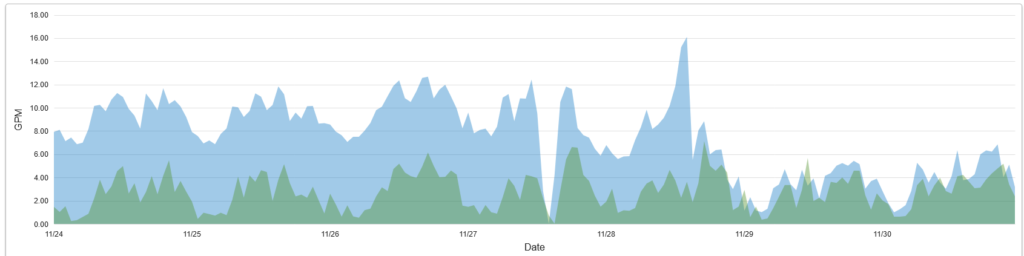
The blue shaded area is water used, i.e. water that comes in at the curb, that I buy from the town, and the green shaded area is water consumed, i.e. water supplied to individual homes, which I bill back to the consumer. The difference between the two is what leaks into the ground. As you can see, wasted water decreased significantly once Mike plugged the leak. In order to fix that, he excavated pipes located six feet underground and installed curb stops to isolate the problem. In addition to that, some Orangeburg pipe has been replaced at the park in central New York. A few more residents have threatened to shoot me. Schrödinger’s redneck has been sighted in town again. The rat bastards in Albany want to liquidate me because I am a Kulak. But all that is becoming routine. As an insurance-company lawyer once wrote, Leopards break into the temple and drink all the sacrificial vessels dry; it keeps happening; in the end, it can be calculated in advance and is incorporated into the ritual.
The options market, by contrast, is infinite. Each morning, the charts are newly painted.
[1] Some options (‘cash-settled options’) grant the holder the right to a cash payment equal to the value that the holder would have received has she exercised her option and immediately sold the underlying. For purposes of this discussion, we will treat cash settled options and options that provide for provision of the underlying itself (‘physically-settled options’) as the same.
[2] The term ‘volatility’ comes from the Latin verb ‘volare’, meaning to fly. An event is volatile to the extent that it flits about the mean. The ‘fly’ word in ancient Greek was πετομαι, and the Slavic root is *let. There appears to be a slight similarity between the Irish ‘fly’ word and the Latin, but I understand that the Celto-Italic subgroup hypothesis is not taken seriously any more. .
[3] I understand that other option markets, such as the commodity option market, are not subject to this bias.
[4] Put-call parity is a manifestation of the role of arbitrage in the market. If ATM puts were more expensive than ATM calls, a trader could (i) sell a put, (ii) short the underlying and (iii) buy a call. This would allow the trader to pocket the difference in price between the put and the call and to not take on any risk. Once the market observed this, everyone would jump in and the price of calls would be bid up and the price of puts be pushed down.